Climate Vulnerability in Greater Boston
MetroCommon ✕ 2050
The impacts of climate change are not distributed equally.
Illustrations by Peter CrowtherA group’s exposure to climate hazards, access to resources, and ability to plan for and rebuild after a climate event all factor into a group’s vulnerability to climate change.
Which populations are most vulnerable to the climate hazards that are likely to impact Metro Boston?
To answer this question, we have constructed a regional climate vulnerability index that shows which neighborhoods in Metro Boston are more vulnerable to climate hazards than others. This mapping tool – which combines sociodemographic, public health, housing, and workforce data with climate exposure data – can be used to help identify which populations should be centered in climate preparedness and resiliency work.

How close is an individual or group to a hazard?
Indicators
Extreme heat (land surface temp)
Flood risk (FEMA Flood Zones)
Future storm surge with 8” of sea level rise
Future storm surge with 3’5” of sea level rise
Woods Hole Group
Boston Harbor Flood Risk Model

The pre-existing social, economic, and political conditions that affect an individual or group’s access to resources or exposure to hazards.
Indicators that describe sensitivity can be grouped into four themes: Age; occupations highly exposed to climate hazards; health; and housing features and demographics.
Indicators
Overcrowded housing units
Population in group quarters
Age 5 or below
Age 65 and up
Central air conditioning
Basements at risk of flooding
Disability prevalence
Cardiovascular disease prevalence
Asthma hospitalization rate
Diabetes prevalence
Highly exposed workers

The ability to get out of harm’s way, adjust to changes, or regroup and rebuild after climate events.
Indicators that describe adaptive capacity can be grouped into four themes: Information access, social networks, and mobility; financial resources; race and ethnicity; and housing demographics.
Indicators
Renter-occupied housing units
Mobile housing units
Households w/o a vehicle
Households w/o internet access
Educational attainment
Unemployment rate
Median household income
Poverty rate
Latinx population
Black population
Asian population
Indigenous, multi or another race
Age 65 and up living alone
Single-parent families
Linguistic isolation
Population w/o health insurance
Population living in different residence
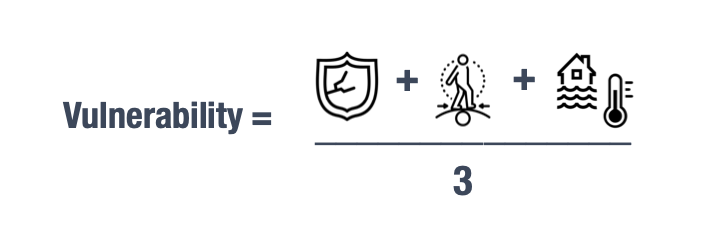
Variables describing climate vulnerability were selected after an extensive literature review and conversations with internal staff and external experts. We created hazard-specific exposure, sensitivity, and adaptive capacity indices by aggregating variables from each dimension. Then, we took the average of the three indices to produce a climate vulnerability index for each climate hazard. Using this index, we created regional maps showing which Metro Boston communities are relatively more vulnerable to extreme heat, current flood risk, and future storm surge flooding risk than others.
For a detailed explanation of the methodology used in this analysis, download the technical documentation below.
Explore the Region
The research overview presentation slides are available for download here.
The methods and technical documentation are available for download here.
The full data and detailed metadata are available for download here.
Share this analysis on social media.
Have any questions or comments? Want to collaborate on further analyses for your city or town? Contact MAPC’s research team here.

MetroCommon ✕ 2050
MetroCommon 2050 is a two-year undertaking that involves multiple phases, topics, and ideas; scores of planners; dozens of external advisors; and hundreds of state and local officials. Most important, it involves thousands of people from all over Metro Boston. It’s a complicated project, but running it smoothly is not enough – the entire point is the result. We must end up with an actionable plan, and one that makes change for the better.
Receive Updates